Experiment Worksheets- Exp 1,2
Algae Bead Module: Lessons, Projects, and Experiments
Experiments: Algae Beads
General NGSS Projects for Photosynthesis, Respiration, and Algal Physiology
Aligned for NGSS Standards:
HS-LS1-5 |
Use a model to illustrate how photosynthesis transforms light energy into stored chemical energy. |
HS-LS1-6 |
Construct and revise an explanation based on evidence for how carbon, hydrogen, and oxygen from sugar molecules may combine with other elements to form amino acids and/or other large carbon-based molecules. |
HS-LS1-7 |
Use a model to illustrate that cellular respiration is a chemical process whereby the bonds of food molecules and oxygen molecules are broken and the bonds in new compounds are formed resulting in a net transfer of energy. |
HS-LS2-5 |
Develop a model to illustrate the role of photosynthesis and cellular respiration in the cycling of carbon among the biosphere, atmosphere, hydrosphere, and geosphere. |
HS-PS1-5 |
Apply scientific principles and evidence to provide an explanation about the effects of changing the temperature or concentration of the reacting particles on the rate at which a reaction occurs. |
HS-PS1-6 |
Refine the design of a chemical system by specifying a change in conditions that would produce increased amounts of products at equilibrium. |
HS-LS4-4 |
Construct an explanation based on evidence for how natural selection leads to adaptation of populations. |
Copyright 2020 by Algae Research and Supply, Inc. Carlsbad CA. All rights reserved.
Algae Research and Supply, Inc.

Carlsbad, CA 92008
Table of Contents
Variable Light Intensity and Algal Photosynthesis
(Algae Bead Experiment 1 of 5) 4
Spectral Tuning and Algal Photosynthesis
(Algae Bead Experiment 2 of 5) 10
Surface Area: Volume and Algal Photosynthesis
(Algae Bead Experiment 3 of 5) 16
Temperature and Algal Photosynthesis
(Algae Bead Experiment 4 of 5) 22
Photopigment Extraction and Analysis
(Algae Bead Experiment 5 of 5) 28
How to use this Module:
This module contains standalone lessons, long-term projects, and experiments using microalgae as a model organism to teach aspects of respiration, photosynthesis, and cellular physiology. Much of the hands-on experimentation employs sodium alginate beads (ASR), similar to Petri agar, and provides a discrete investigation unit for students to manipulate. ARS provides pre-made beads and liquid cultures and instructions for making your own beads if you wish to do so!
Lessons are suggested materials and activities to educate on photosynthesis and respiration using algae beads. They are formatted into tables for easy processing and digestion. Each sub-lesson within a table contains suggested duration, content including links to videos, “Learning outcomes,” “let me prove it.” Each activity directs students to read the content and a learning outcome of that activity. After the students have read the paragraph of material, they are directed to answer the “let me prove it” questions that solidify the material they learned. Feel free to change and augment the lessons. Use them as a suggestion for presenting the relevant concepts to your class; add, expand, or remove topics according to your desired curriculum.
Projects are long term and guided lab sessions that do not require hypothetical formulation. They teach students algal culturing and maintenance, as well as create stocks for future experiments. Project Worksheets are designed to act as an easy-to-use lab notebook, an essential component of any scientific endeavor.
The experiments below are what they sound like, discrete lab sessions containing background information, lists of necessary material and methods, and a worksheet section for hypothesis-building and data collection. Teachers are encouraged to augment or add to these experiments to fit your desired curriculum.
|
Lessons
|
Projects |
Experiments |
Variable Light Intensity and Algal Photosynthesis
(Algae Bead Experiment 1 of 5)
|
Project Summary: This experiment aims to observe the effects of the variable distance from a lightbulb (variable light intensity) on the rates of algal photosynthesis. You will be placing tubes containing algae beads immersed in a nutrient and pH indicator solution. As the algae photosynthesize, they will change their solution’s pH as they draw in carbon dioxide. We can use this change to measure photosynthesis indirectly.
Time Estimates: 45 minutes (depending on time intervals)
Learning Outcomes:
Classroom Prep: Divide class into lab groups if desired. See the materials list for the required components
Videos:
Vocabulary: Inverse Square Law, turbidity, photoinhibition |
Background
Photosynthesis requires quantized particles of light named photons to begin establishing the hydrogen ion gradient powering the ATP Synthase responsible for energy generation. Algae can’t harvest 100% of the source’s light energy, be it a lightbulb or the Sun itself. Light intensity (the amount of photons of light per unit area) decreases as a function of the distance from its source squared, known as the Inverse Square Law.
The Inverse Square Law means that light intensity decreases radically even between small distances, as squaring the distance inflates light’s effect significantly. In addition to this, the turbidity (or cloudiness) of the water that algae are suspended in can decrease available light. Algae have developed a vast toolbox for competing against one another for the light provided to them, be it different pigments that allow them to harvest light at greater depths, or killer chemicals that eliminate the competition.
Therefore you might assume that the very top of the water column would be the best habitat for algae, right? In actuality, algae can receive too much light and have their growth inhibited as a result. The top few meters (depending on location) of the water column is known as the euphotic (too much light) zone and is often devoid of photosynthetic life. Algal cultures under artificial light can also be photoinhibited, making the distance from a light source very important for an algal sample.
This experiment aims to observe the effects of the variable distance from a lightbulb (variable light intensity) on the rates of algal photosynthesis. You will be placing tubes containing algae beads immersed in a nutrient and pH indicator solution. As the algae photosynthesize, they will change their solution’s pH as they draw in carbon dioxide. We can use this change to measure photosynthesis indirectly.
Materials (per group)
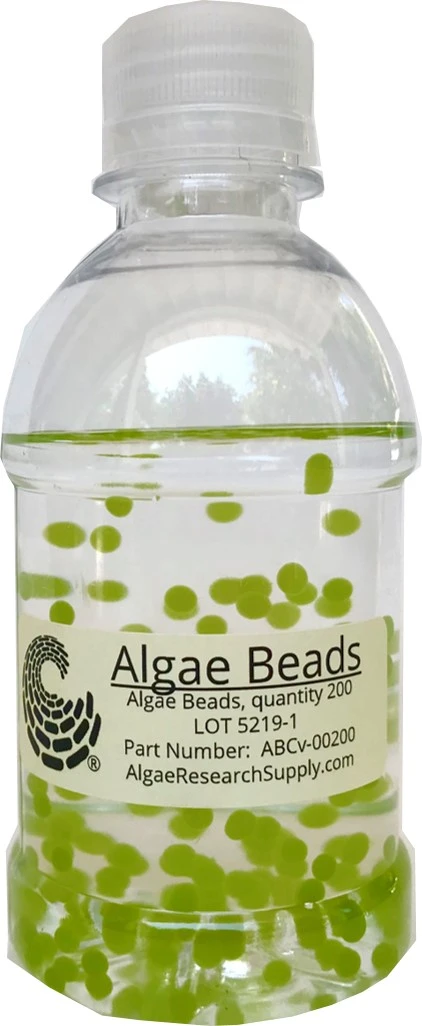
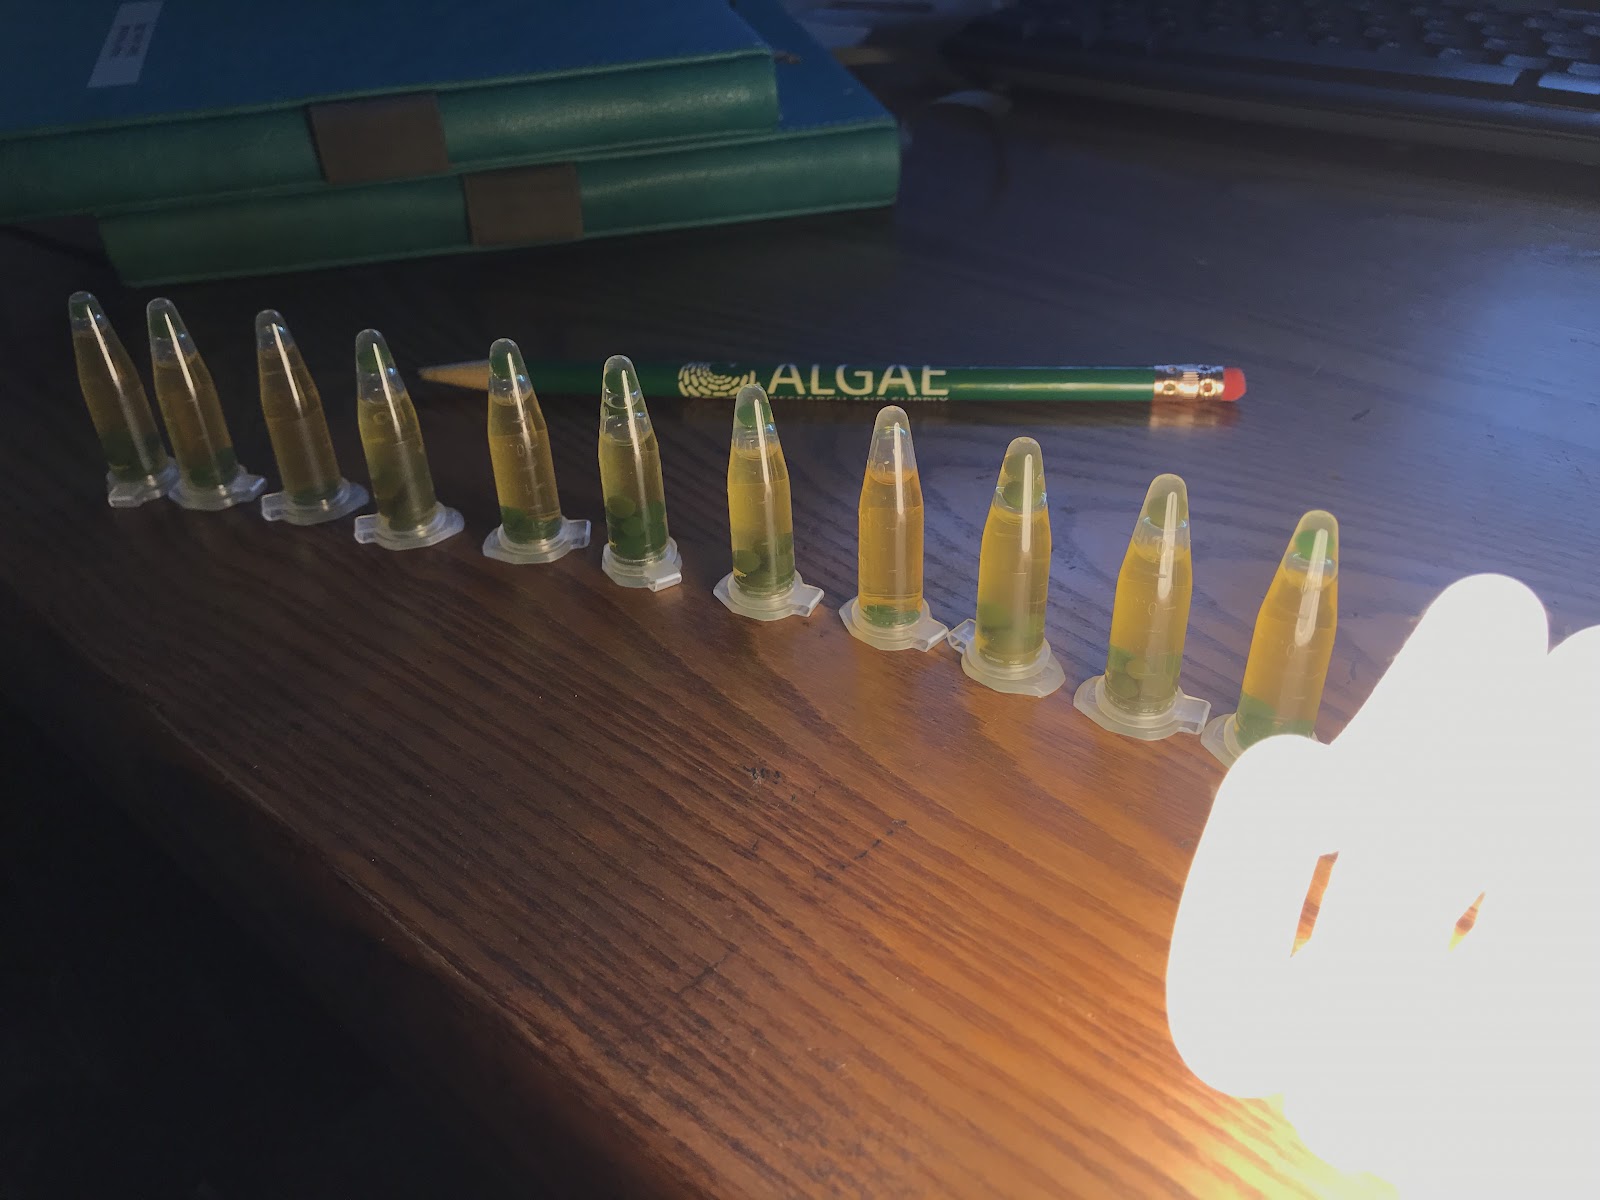
- 5-100 vials of ARS Algae Beads in pH indicator (20 is about perfect)
- Make your own algae beads kit, (AB-DIY-01000)
- Buy our Ready-to-Go Algae Beads (AB-RTG-0030)
- Light meter
- Good option: the Google Science Journal app (available for free on iOS and the Google Play Store. This app has a light meter that displays ambient light intensity in units of electron volts (eV).
- https://sciencejournal.withgoogle.com/experiments/getting-started-with-science-journal/
- Best option: PAR-meter measures Photosynthetically Active Radiation (PAR) (400-700nm) in units of μmol photons / cm2
- A single bright light source like a compact fluorescent lamp or LED
- Colorimetric pH indicator scale
- Aluminum foil
Tips and Considerations
- The distance from the light source will obey the inverse square law for light attenuation (I=1/d2).
- Set up your light source with lots of room to place cultures around it. Ideally, the entire class would use the same light, but if that is not possible, ensure that you have the same lightbulb make and model.
- The time intervals data should be recorded may change depending on the power of the light you use.
- Use tape to mark precisely where the vials were placed and record the distance, as you will be picking them up and putting them back down when you measure pH. Ensure you record the data as fast as possible while maintaining accuracy, so as not to stunt the ongoing photosynthesis for too long.
- You may want to keep each distance constant across different groups’ tubes, but you can also place their tubes at different distances to get a more resolved image of the light intensity drop-off. It is your choice!
Procedure
- Set up your light source so that each group can arrange their tubes equidistant from each other to maintain consistent results across groups.
- Take each of your tubes containing algae beads and place them in a row near the light source. Place tape below each tube location and record the distance between the light source and the tube.
- Wrap one tube in aluminum foil as a control for comparison. Aluminum foil does not let any light pass through.
- Do not put algae beads in one tube as a standard of control for the pH indicator.
- In the presence of light, the algae within will begin to photosynthesize, and the process may change the pH of the solution. The pH change will cause a colorimetric change in the pH indicator included in the solution. At set time intervals, remove the tubes from their placement and quickly compare their color to the included colorimetric pH scale.
- Record the data in the provided table, then graph it on the provided template.
Worksheet
Hypotheses: Predict the relationship between distance from a light source and photosynthetic activity. Explain your answer using what you have learned about the chemicals involved in photosynthesis.
Do you think there is a distance that would be too close to the light source to photosynthesize effectively? Why or why not? Explain your reasoning below.
Variables: What is our independent (manipulated) variable? Which is our dependent (responding) variable? Which variables are controlled across treatments?
Data
The initial intensity of the lightbulb at the source (eV-from google labs app light meter):
Time interval (min):
Tube |
Distance (cm) |
Intensity (eV) |
pH at time= 0
|
pH at time= |
pH at time= |
pH at time= |
pH at time= |
pH at time= |
Control (without algae beads) |
||||||||
|
Light Control with algae beads (foil wrapped) |
||||||||
Tube 1 |
||||||||
Tube 2 |
||||||||
Tube 3 |
||||||||
Tube 4 |
||||||||
Tube 5 |
||||||||
Tube 6 |
||||||||
Tube 7 |
||||||||
Tube 8 |
Below, graph the change pH over time for each tube.

Analysis/Conclusion
According to your data, how did variable light intensity affect the rate of algal photosynthesis? Were there any outliers? Were your results similar to the results of other groups?
Did you notice any distances that seemed to hurt the algae or prevent the algae from photosynthesizing properly (photoinhibition)?
Restate your hypothesis, was your prediction correct? Based on your data, does variable light intensity affect photosynthesis? Why or why not?
(Claim Evidence Reasoning) CER Rubric
Check your work! |
||
|
Claim – a conclusion that answers the original question |
|
|
Evidence – scientific data that supports the claim |
|
|
|
Reasoning – a justification that links the claim and evidence |
|
|
Spectral Tuning and Algal Photosynthesis
(Algae Bead Experiment 2 of 5)
|
Project Summary: This experiment aims to test the effect different light wavelengths have on rates of algal photosynthesis. You will be growing algae under four different light wavelengths (different colors), and determining the optimal wavelength for the growth of the species of algae encased within our algal beads.
Time Estimates: 45 minutes (depending on time intervals)
Learning Outcomes:
Classroom Prep: Divide class into lab groups if desired. See the materials list for the required components
Videos:
Vocabulary: spectral tuning, |
Background
As we learned in Experiment 1, the variable light intensity can influence rates of algal photosynthesis. But the experimental setups in Experiment 1 were conducted with a white light source. If you've ever shone light through a prism (or looked at the album art for Pink Floyd's "Dark Side of the Moon"), you know that white light is composed of all color wavelengths in the visible spectrum. So while we perceive the light that appears to be a single wavelength, what's happening is we perceive the light of nearly all wavelengths at once.
Algae do not harvest 100% of light provided by the source due to the Inverse Square Law. Algae’s inability to absorb all light becomes even more of a conundrum when we realize it's not just reflecting some light, it is actively harvesting specific wavelengths and unable to process others. The inability to photosynthesize all light is due to the photopigments' chemical structure, be they chlorophylls, phycobilisomes, or rhodopsins. These photopigments capture light most effectively at a single wavelength and decrease efficiency as the incident wavelength shifts from the target wavelength, leading to a characteristic "peaks" that can identify algae strains. While most algae use chlorophyll as their primary harvesting pigment, they vary the composition of accessory pigments that help "funnel" light into their chloroplasts' primary reaction centers.
Varying photopigment composition allows algae to function most efficiently in different lighting conditions, eliminating the need for direct competition with other species. These lighting conditions are caused by different depths (as red light disperses quickly with increasing depth) or how clear the water is (lots of algae or dirt changes the way light travels through water). When algae have adjusted photopigments for light dispersal, the effect is called spectral tuning.
This experiment aims to test the effect different light wavelengths have on rates of algal photosynthesis. You will be growing algae under four different light wavelengths (different colors), and determining the optimal wavelength for the growth of the species of algae encased within our algal beads.
Materials
- 5-100 vials of ARS Algae Beads in pH indicator (20 is about perfect)
- Make your own algae beads kit, (AB-DIY-01000)
- Buy our Ready-to-Go Algae Beads (AB-RTG-0030)
- Colored light-absorbing screens Blue, Green, Yellow, Red
- Options for making the screen include:
- Print out the a with different colors on an overhead projector sheet (ask your grandparents what an overhead projector is/was…)
- Any translucent plastic should work too- Kids plastics, the theatre group, art store, or even color them with a marker.
- Colored plastic bags
- Color marker on the tube
- Light source
- Light meter (See Experiment 1 for information about Google Science Journal)
- Goggles
Tips and Considerations
- Remember that we want to manipulate only one independent variable (light wavelength), so we need to control light intensity to remain the same across treatments. This can be accomplished by arranging tubes in a circular pattern similar to the image below. If your light does not provide 360° illumination, you can perform one treatment at a time from a constant distance and switch out color screens each time.
- Different colored screens may absorb more light even when placed at the same distance from a source. Check with your light meter; you may need to place the screens at different distances.
- Mark the distance from the tube to the light with a piece of tape to keep the overall intensity constant. Also, mark the distance from the light to the color screen. That way, everything remains constant as you switch wavelengths.
- Remember that you need a control treatment with white light to determine if the algal photosynthesis rate is more or less effective at a given wavelength.
Procedure
- Arrange your screens as shown below, if 360° illumination is provided, or refer to the “Tips” section for other types of lightbulbs. Ensure that each screen is providing the same light intensity. You may need to place them at different distances to achieve this.
- Place a tube of algae beads behind each of the four screens, and place a control tube without a screen to receive white light.
- At set intervals of time, record the colorimetric pH of each tube using the provided scale. Plot the data on the provided graph paper.
- Be sure to record the initial pH of each tube; they should be roughly equal to each other.
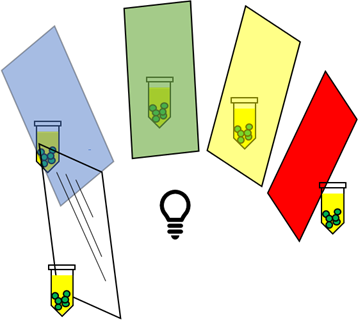
Image: Possible setup to expose algae beads to a single light source. Be sure to measure the intensity at each location to create identical scenarios for each alga. Some screens may absorb more light overall.
Worksheet
Hypotheses: After determining the wavelength provided by each color screen (check the electromagnetic spectrum), predict which wavelength you think the algae Chlorella vulgaris will absorb best for photosynthesis? Why do you think that?
Variables: What is our independent (manipulated) variable? Which is our dependent (responding) variable? Which variables are controlled across treatments?
Data
Tube Color |
Distance (cm) |
Intensity (eV) |
pH at time=0
|
pH at time= |
pH at time= |
pH at time= |
pH at time= |
pH at time= |
Control |
||||||||
Red |
||||||||
Green |
||||||||
Yellow |
||||||||
Blue |
Below, graph the change pH over time for each tube.
Analysis/conclusion
According to your data, which wavelength yielded the highest rate of photosynthesis? Did the control sample go through photosynthesis faster than the treatments? Which color shows the least amount of photosynthesis?
Restate your hypothesis, was your prediction correct? Based on your data, does spectral tuning exist in Chlorella vulgaris? How can you tell?
Extending questions:
Design an LED light that would be most effective for this strain of algae.
Do some research! Are there any existing LED lights that are optimized for green plants? Are the commercially manufactured LED light’s output colors the same as your hypothesized LED?
CER Rubric
Check your work! |
||
|
Claim – a conclusion that answers the original question |
|
|
Evidence – scientific data that supports the claim |
|
|
|
Reasoning – a justification that links the claim and evidence |
|
|
Page -