Your students could discover an algae no one has ever named.
Algae Research and Supply is building a FEDERALLY FUNDED hands-on microbiology program where students isolate living algae from real samples and add their findings to a national science platform. We are recruiting teachers now to help test it.
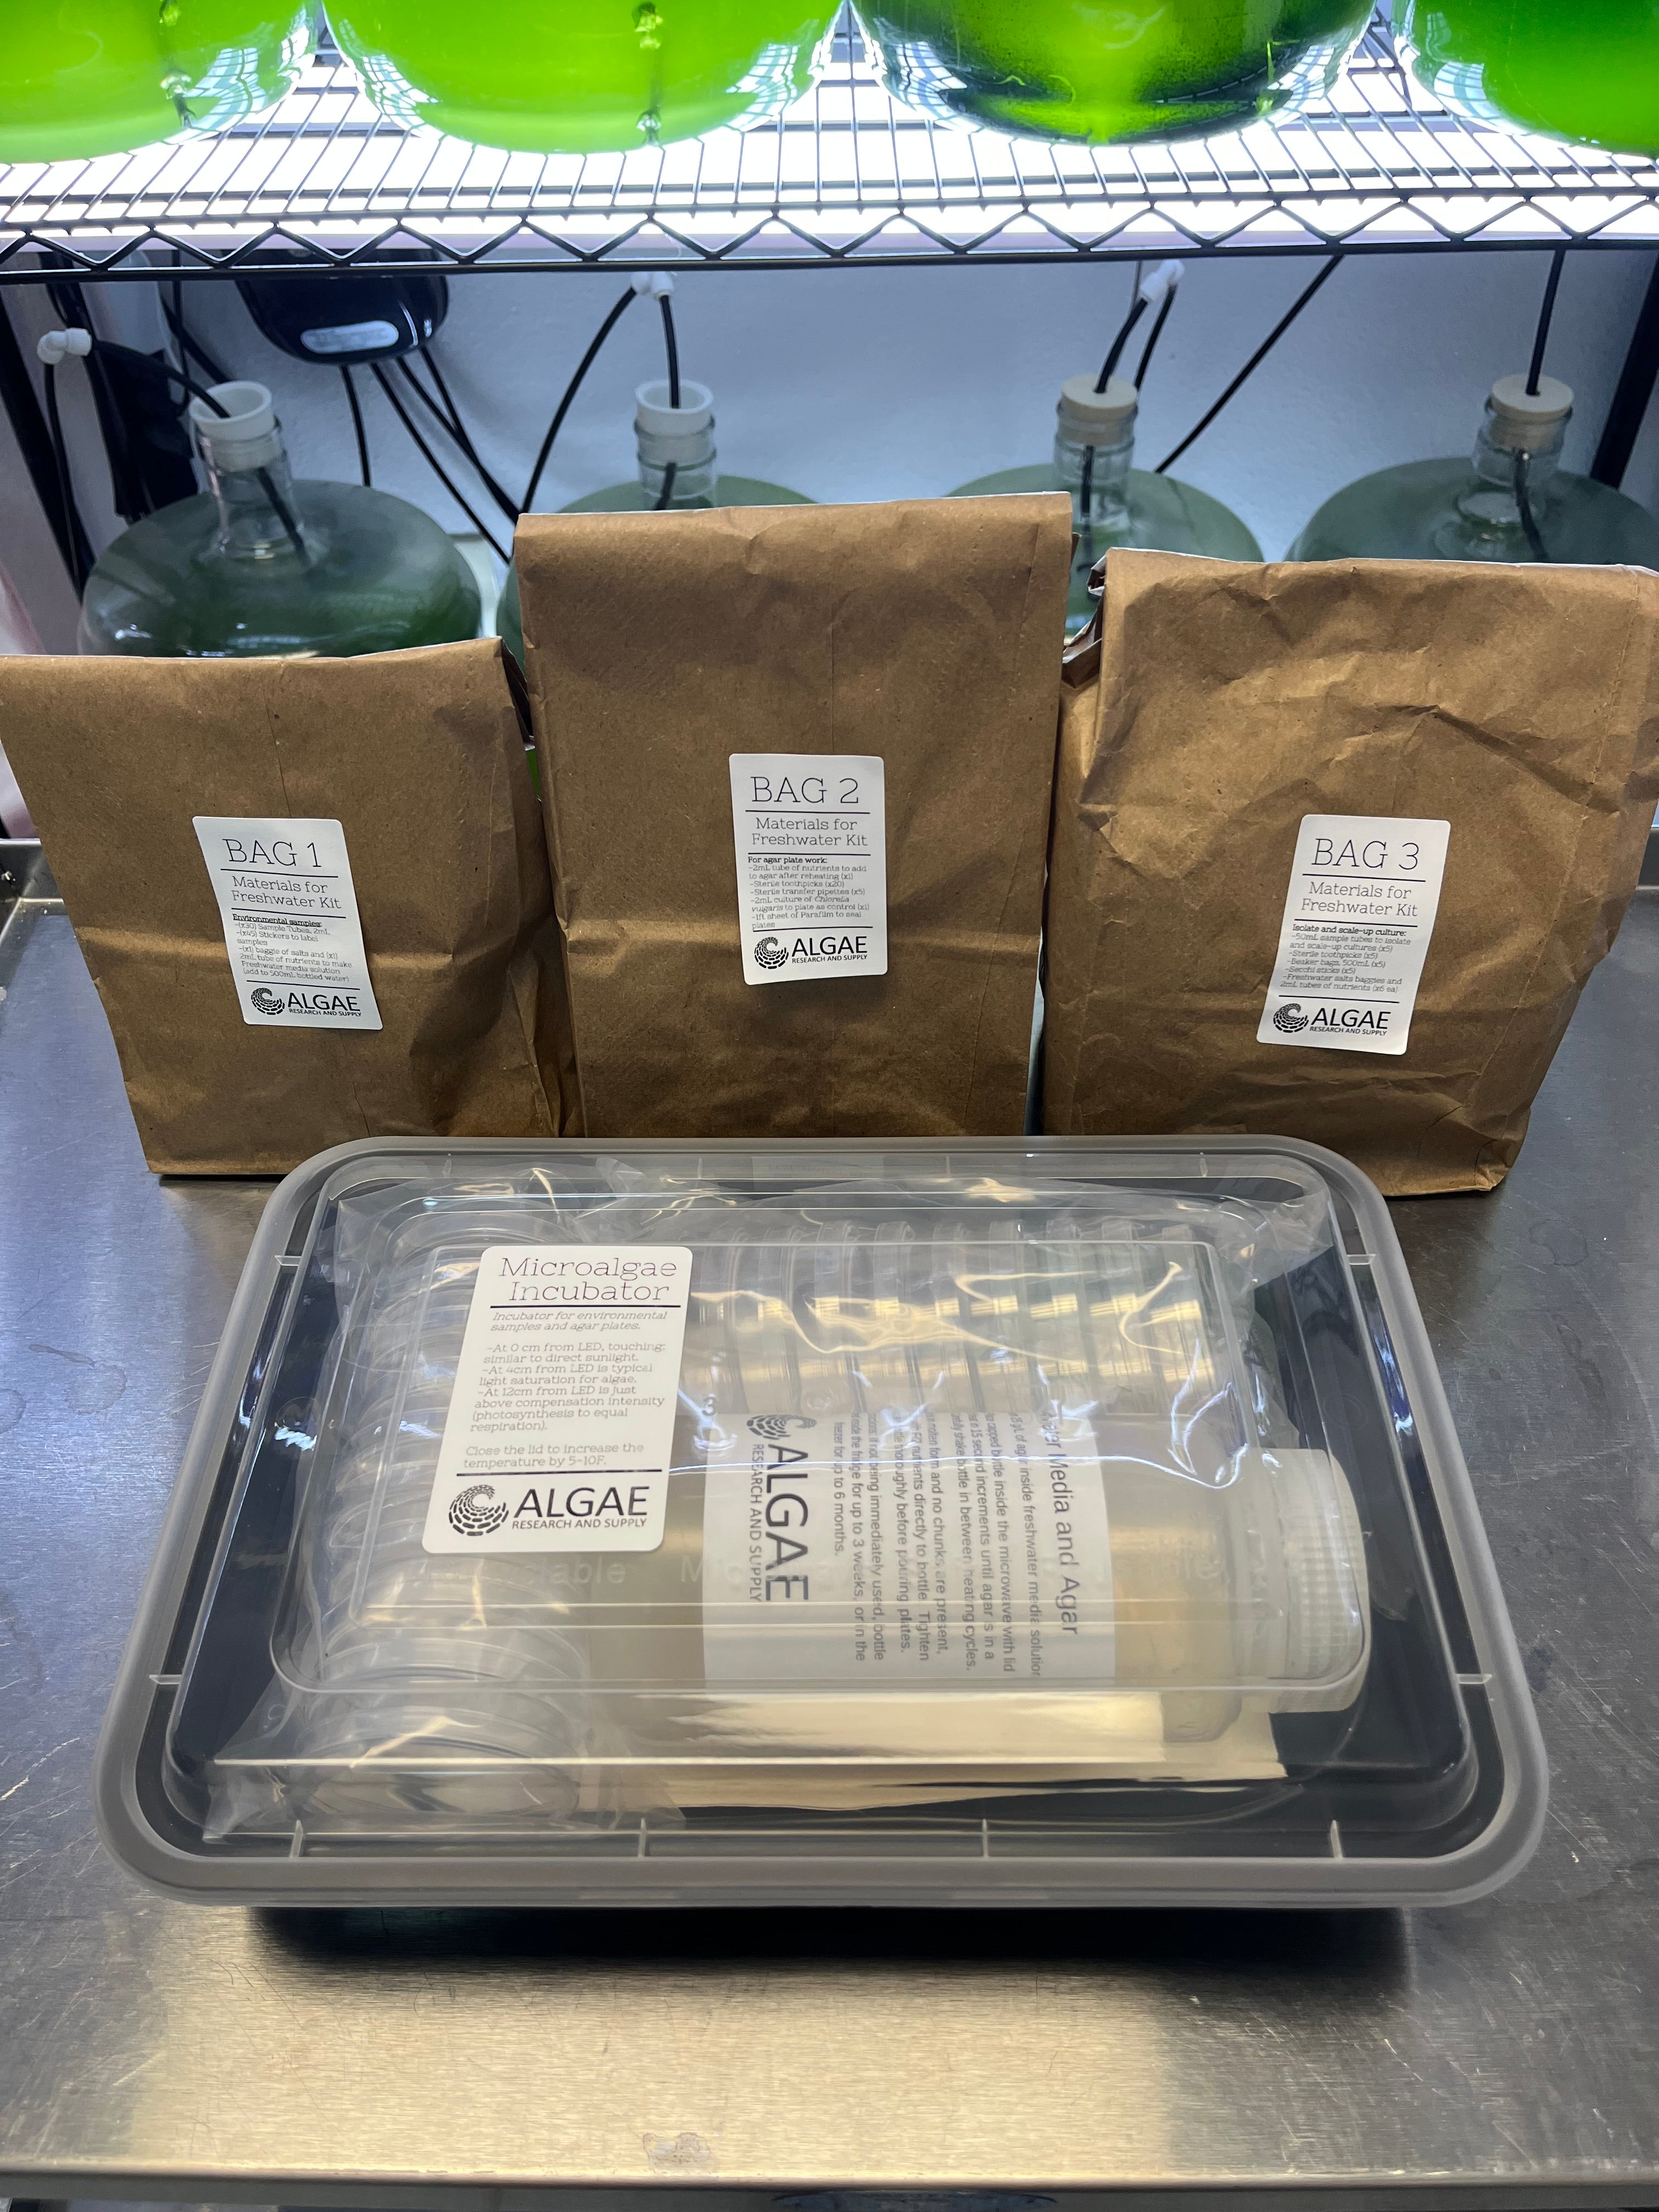
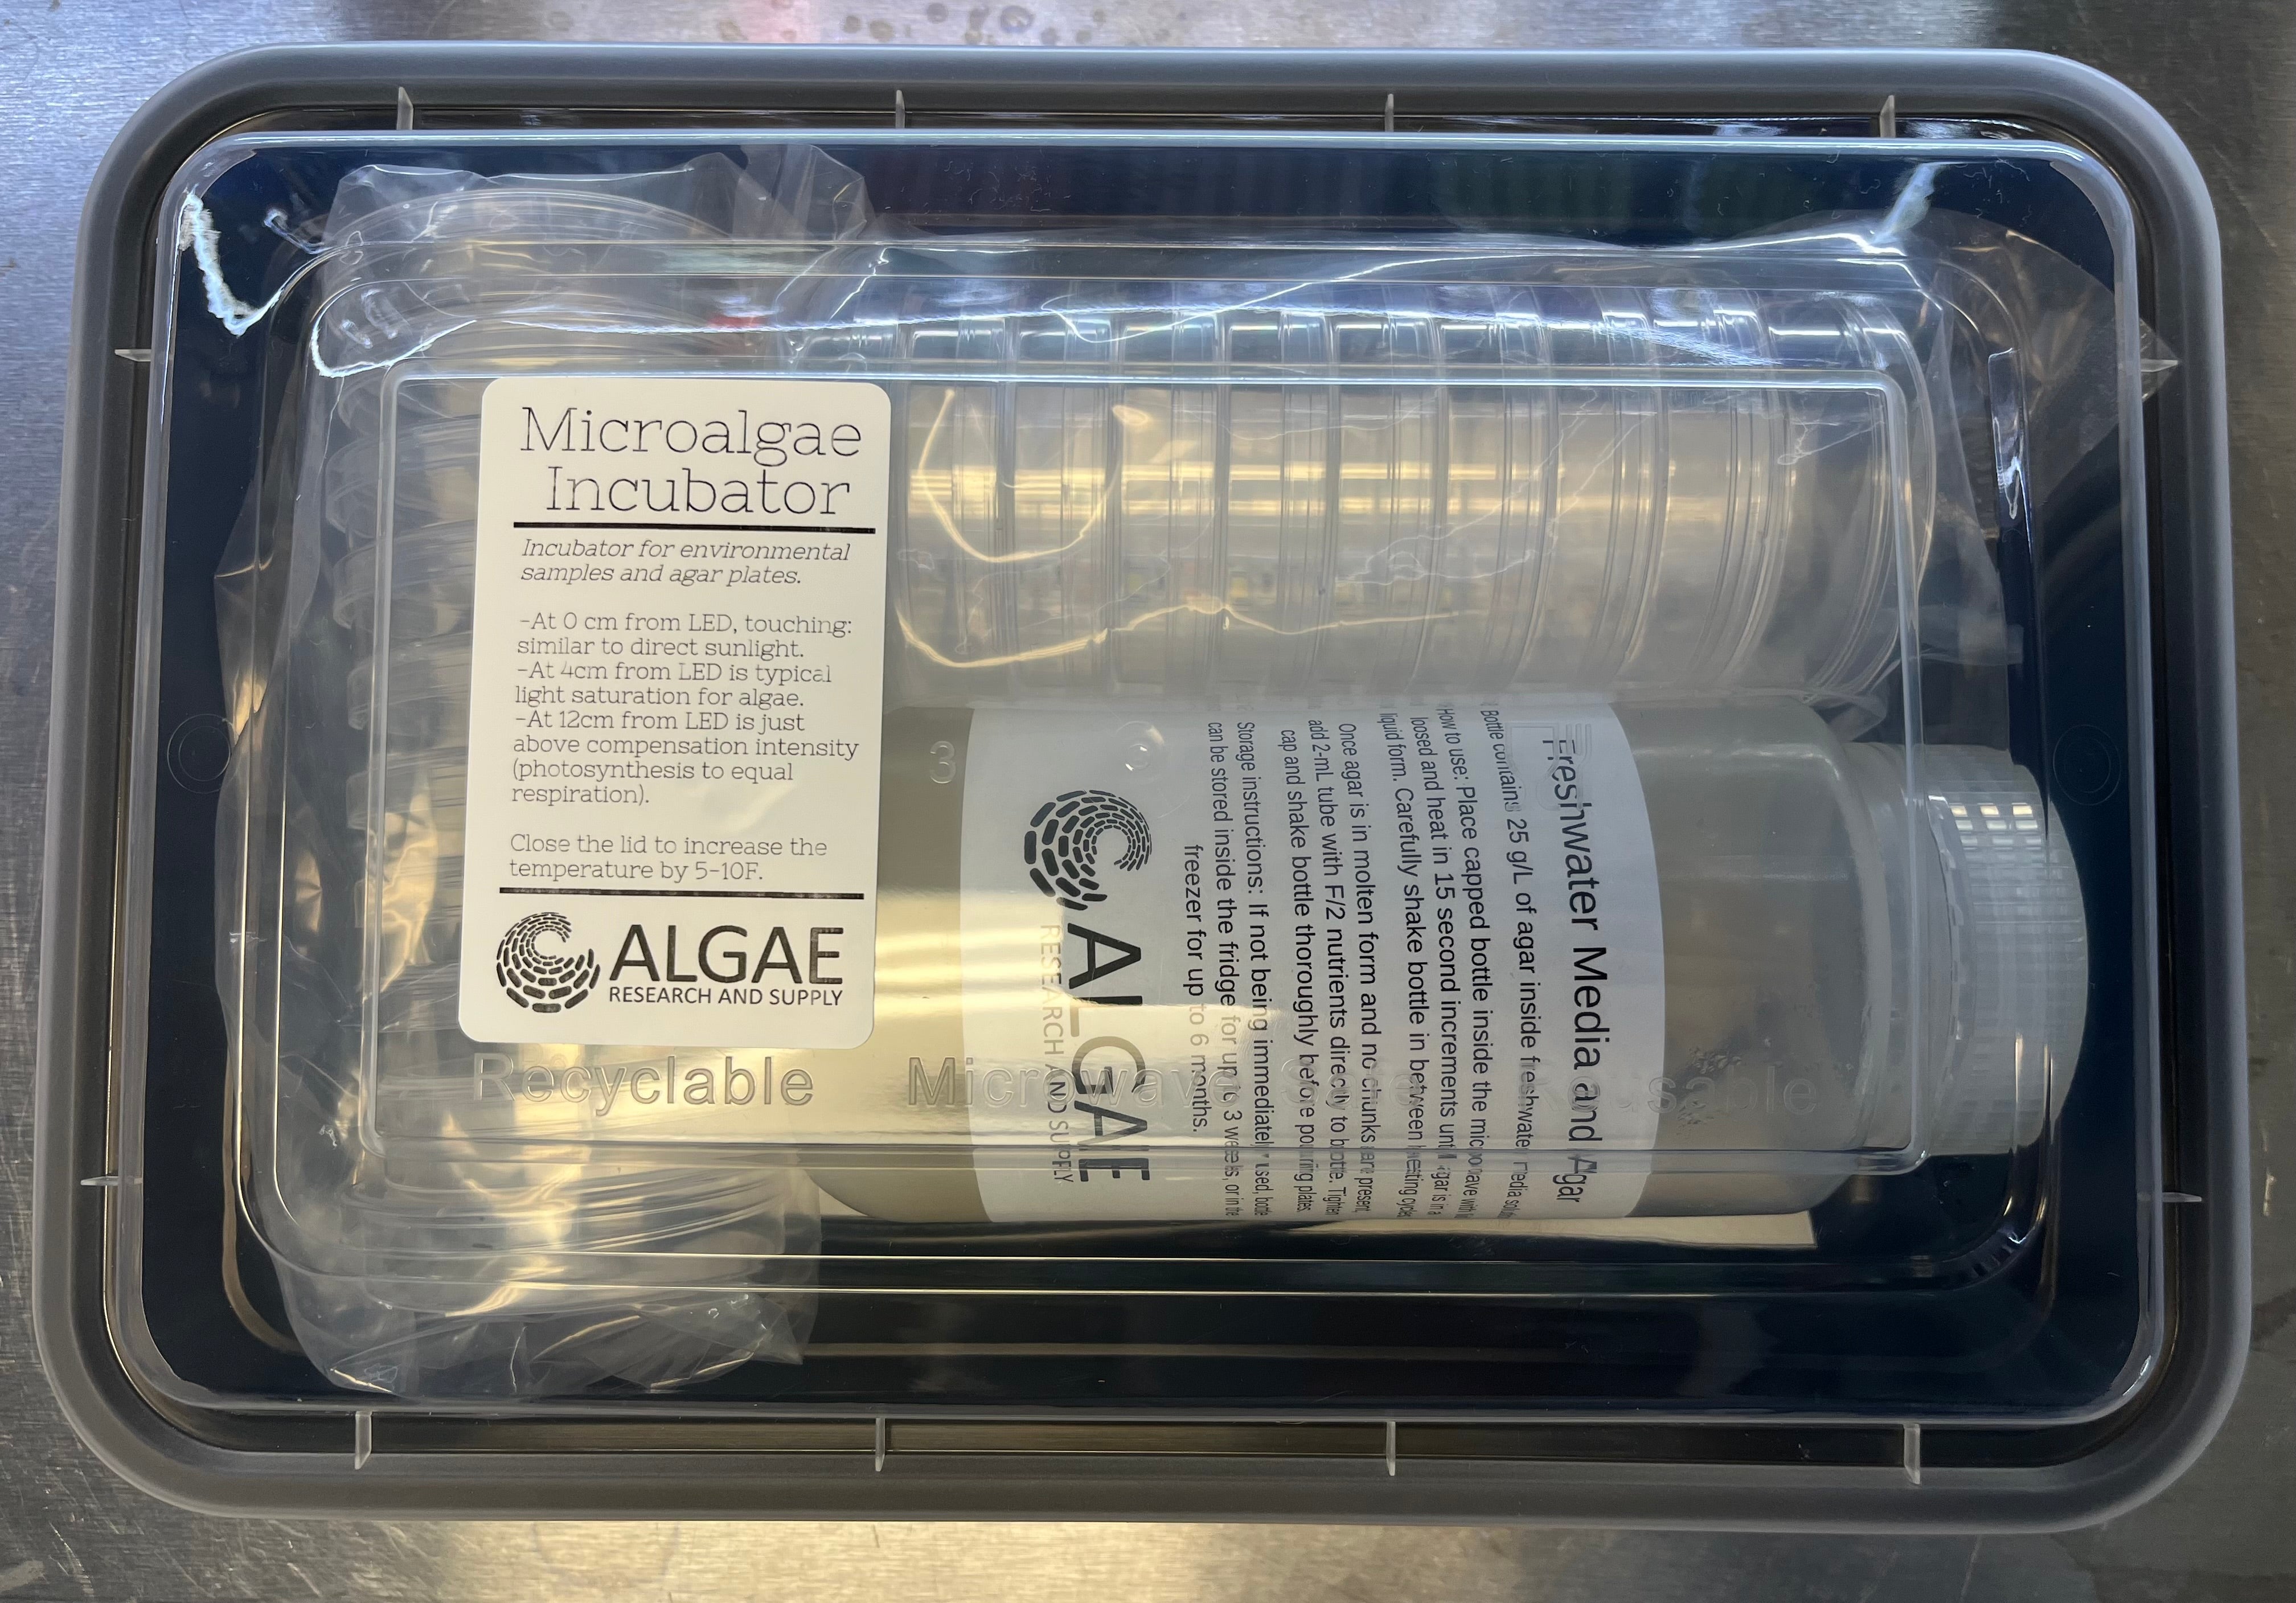
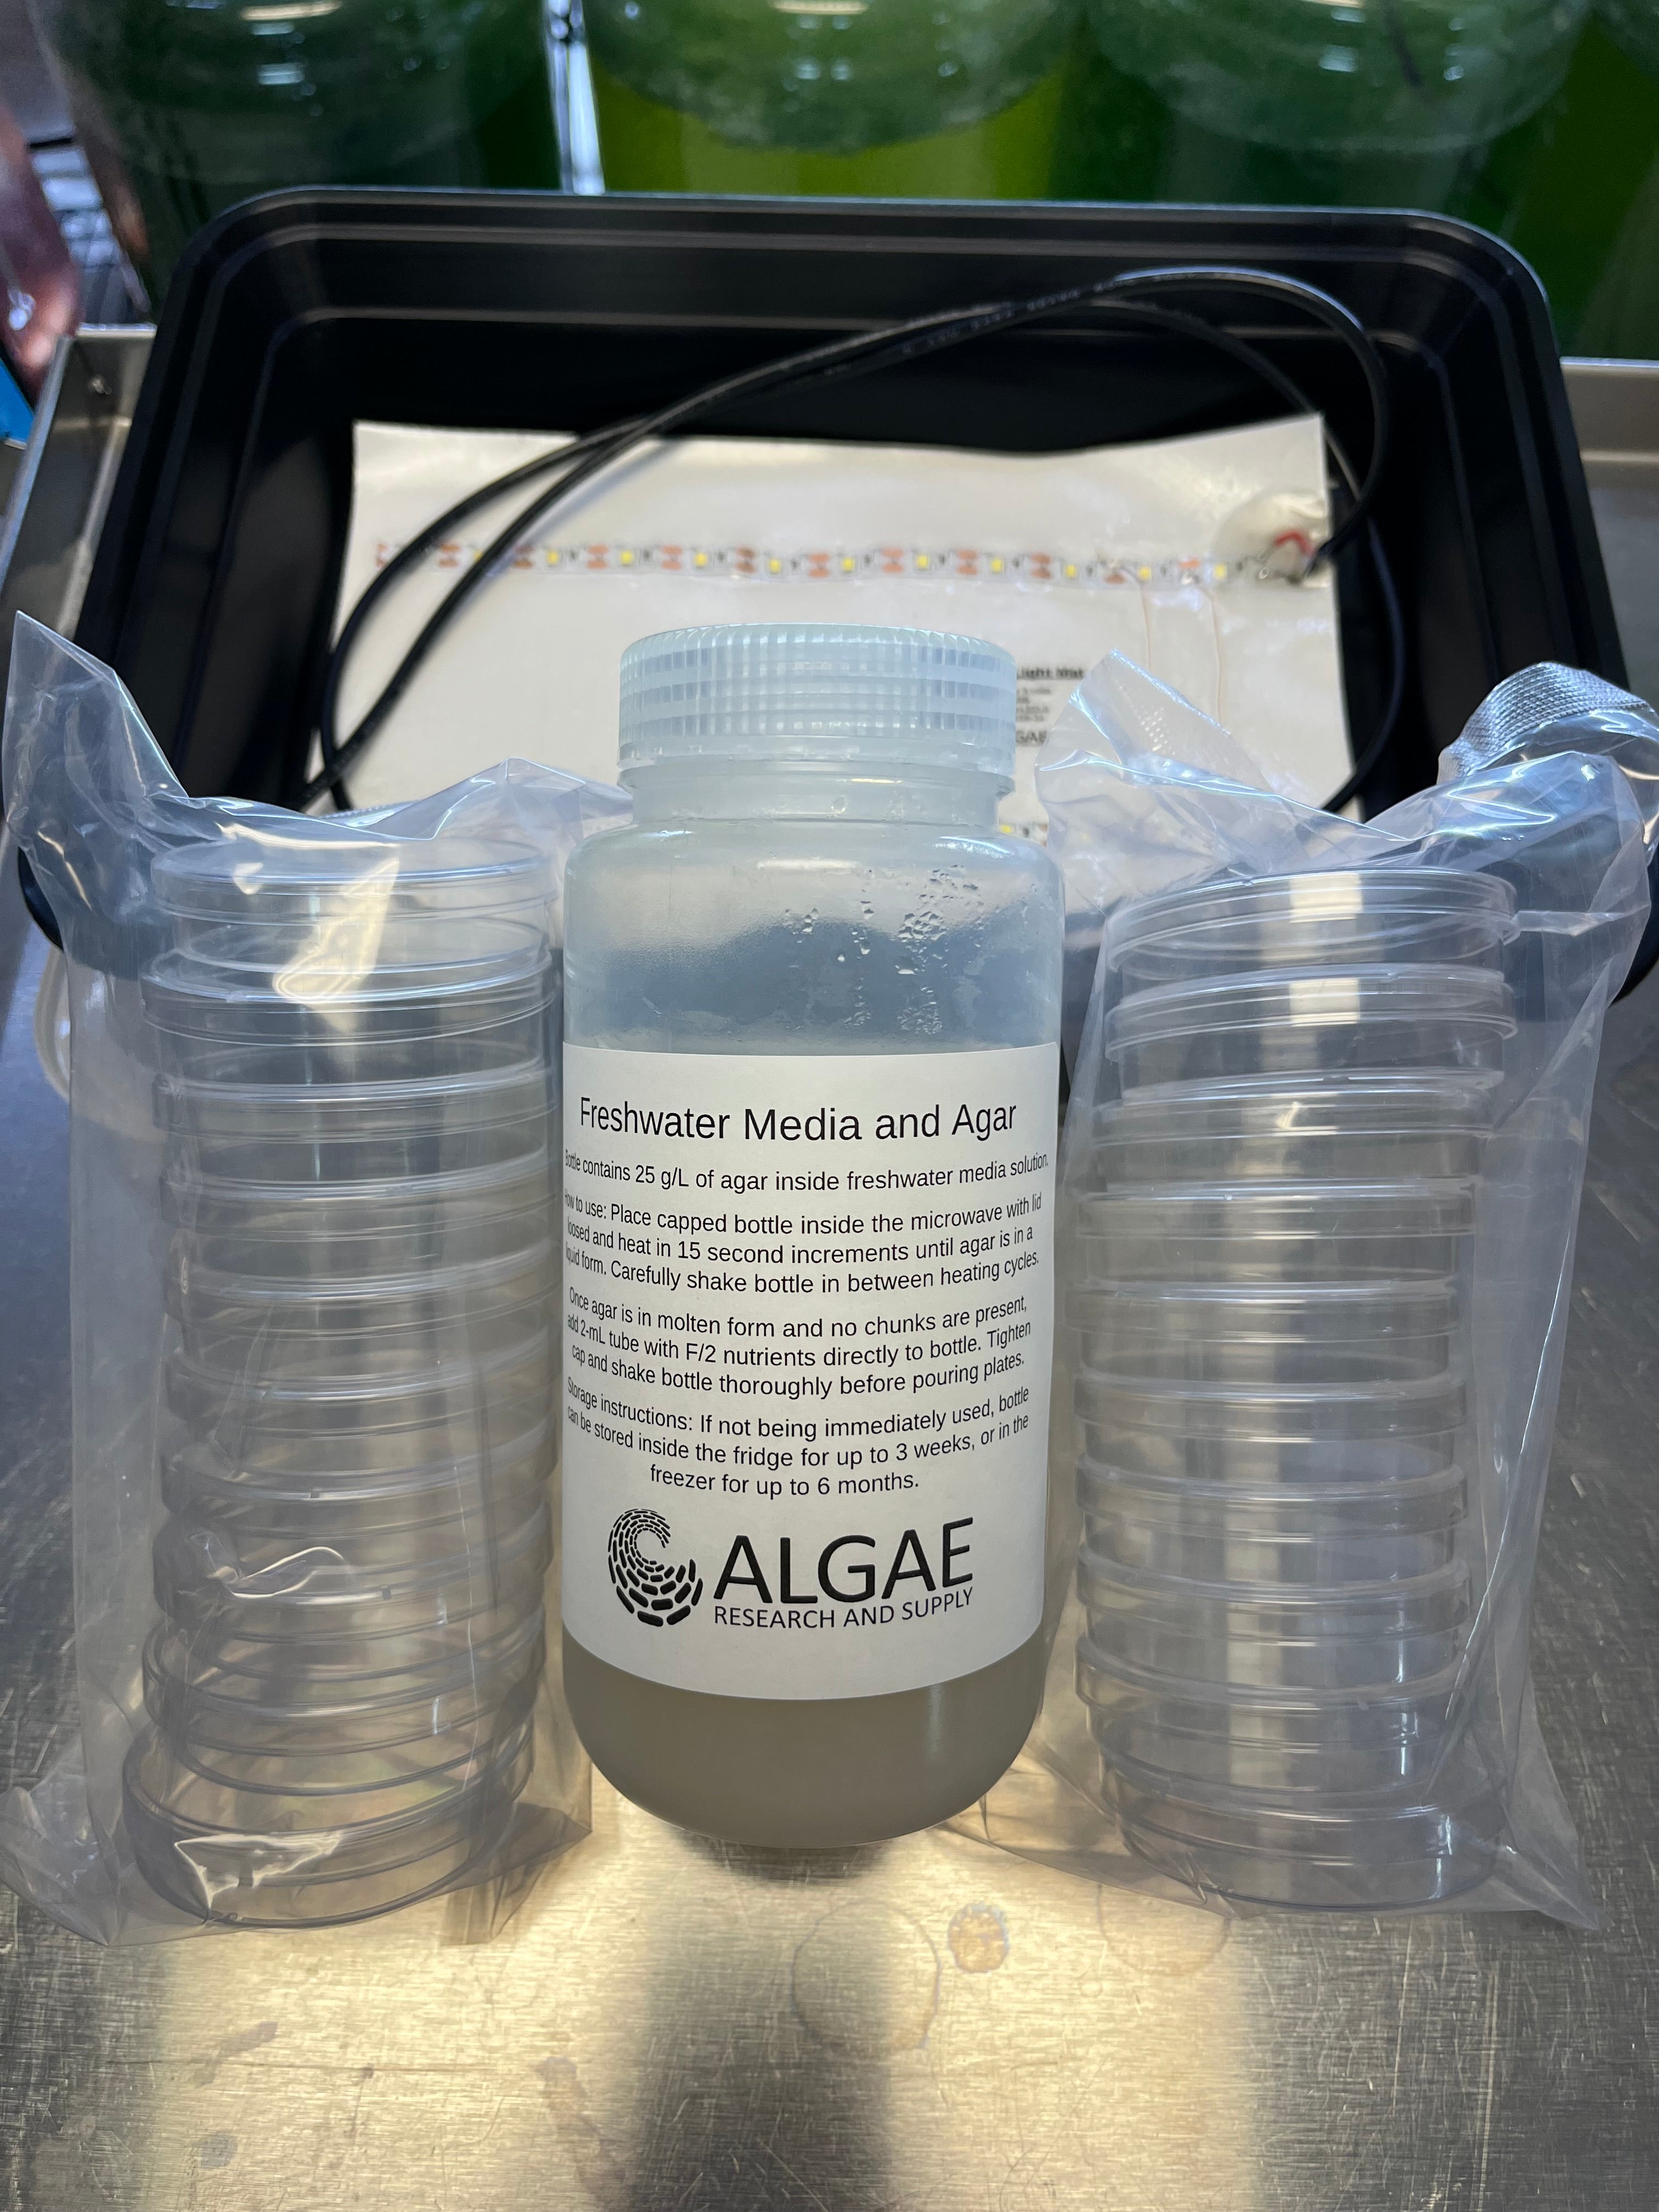
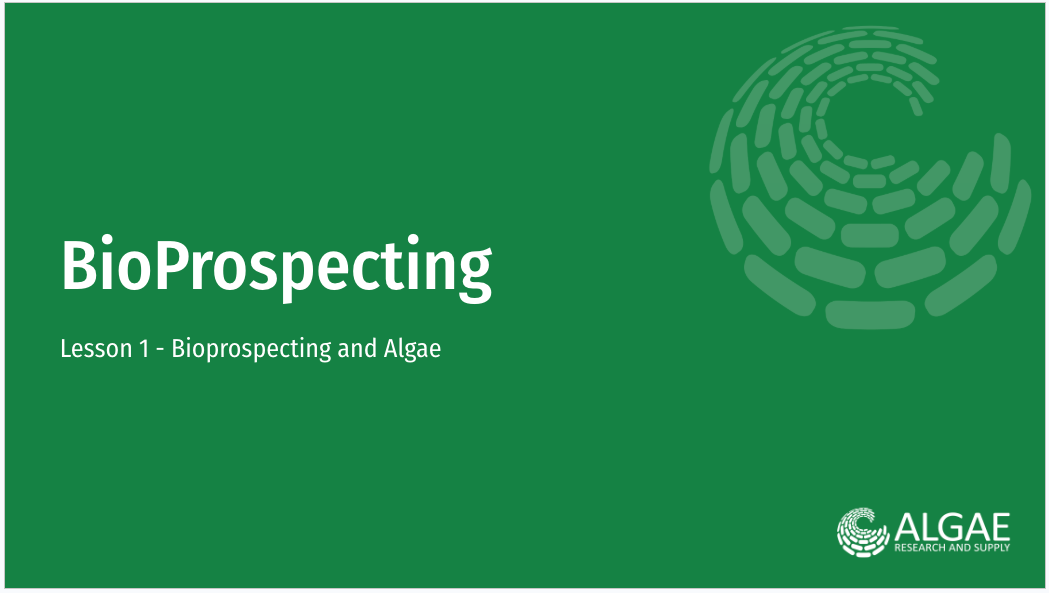
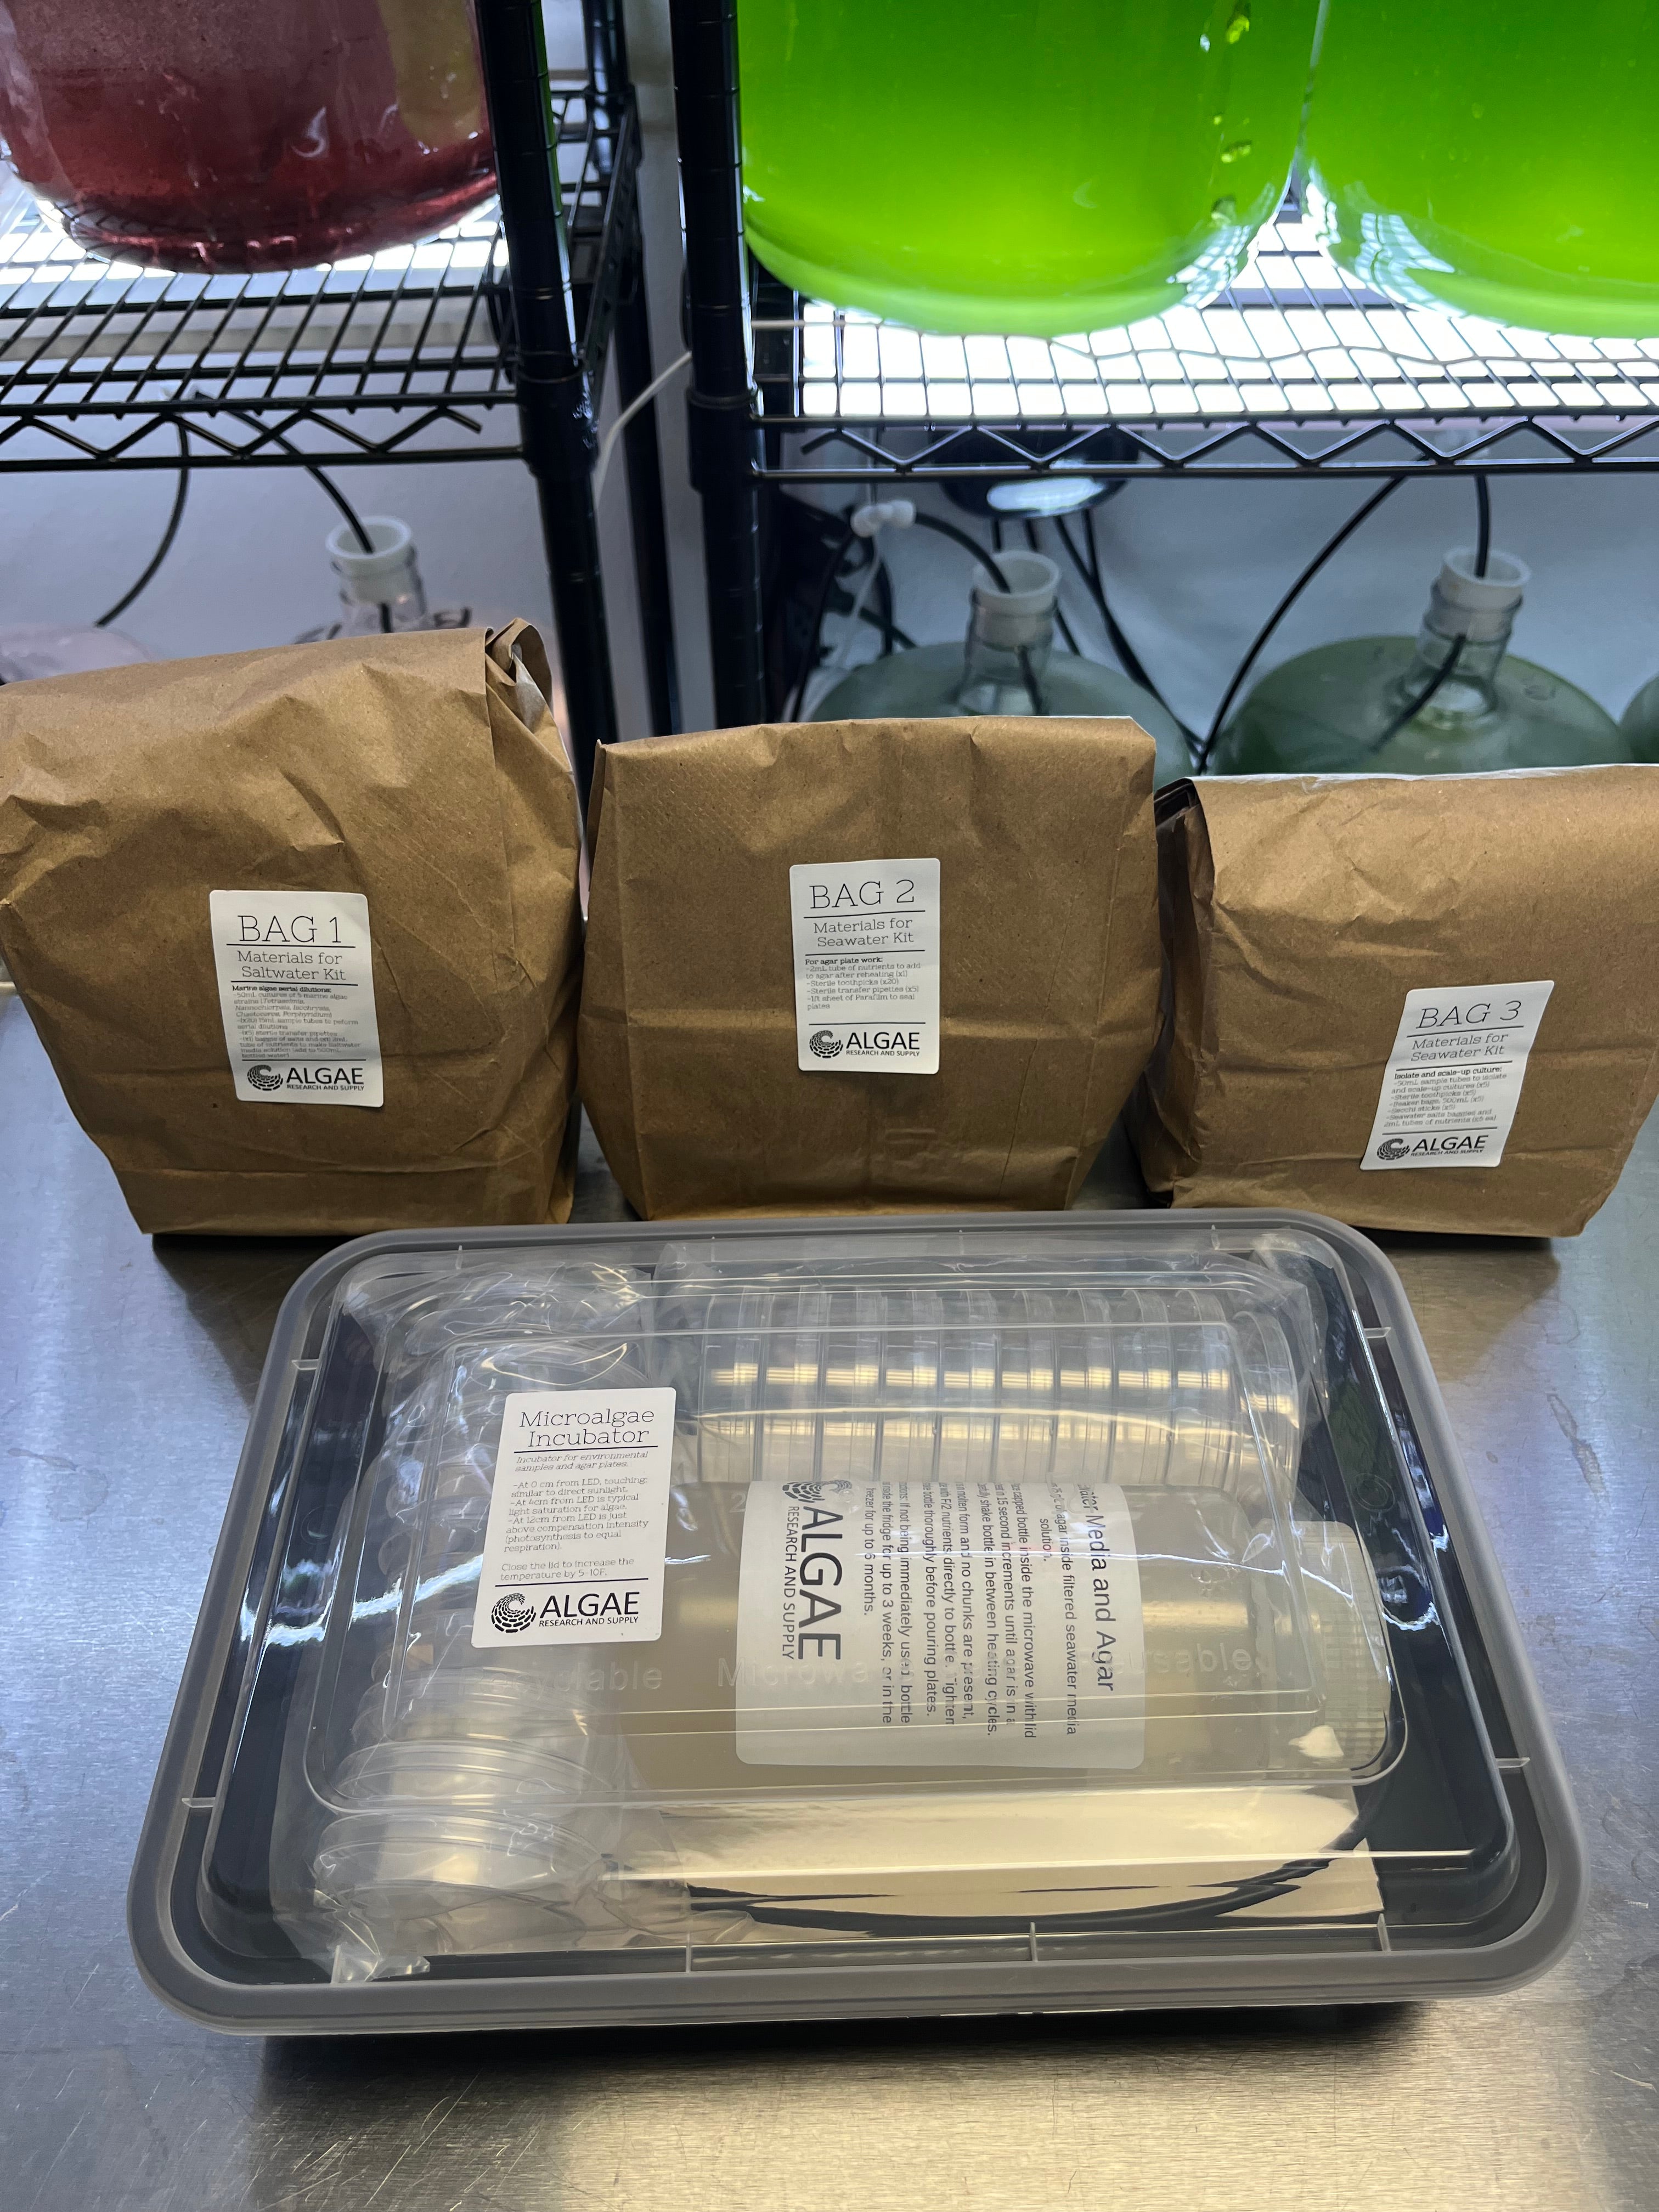
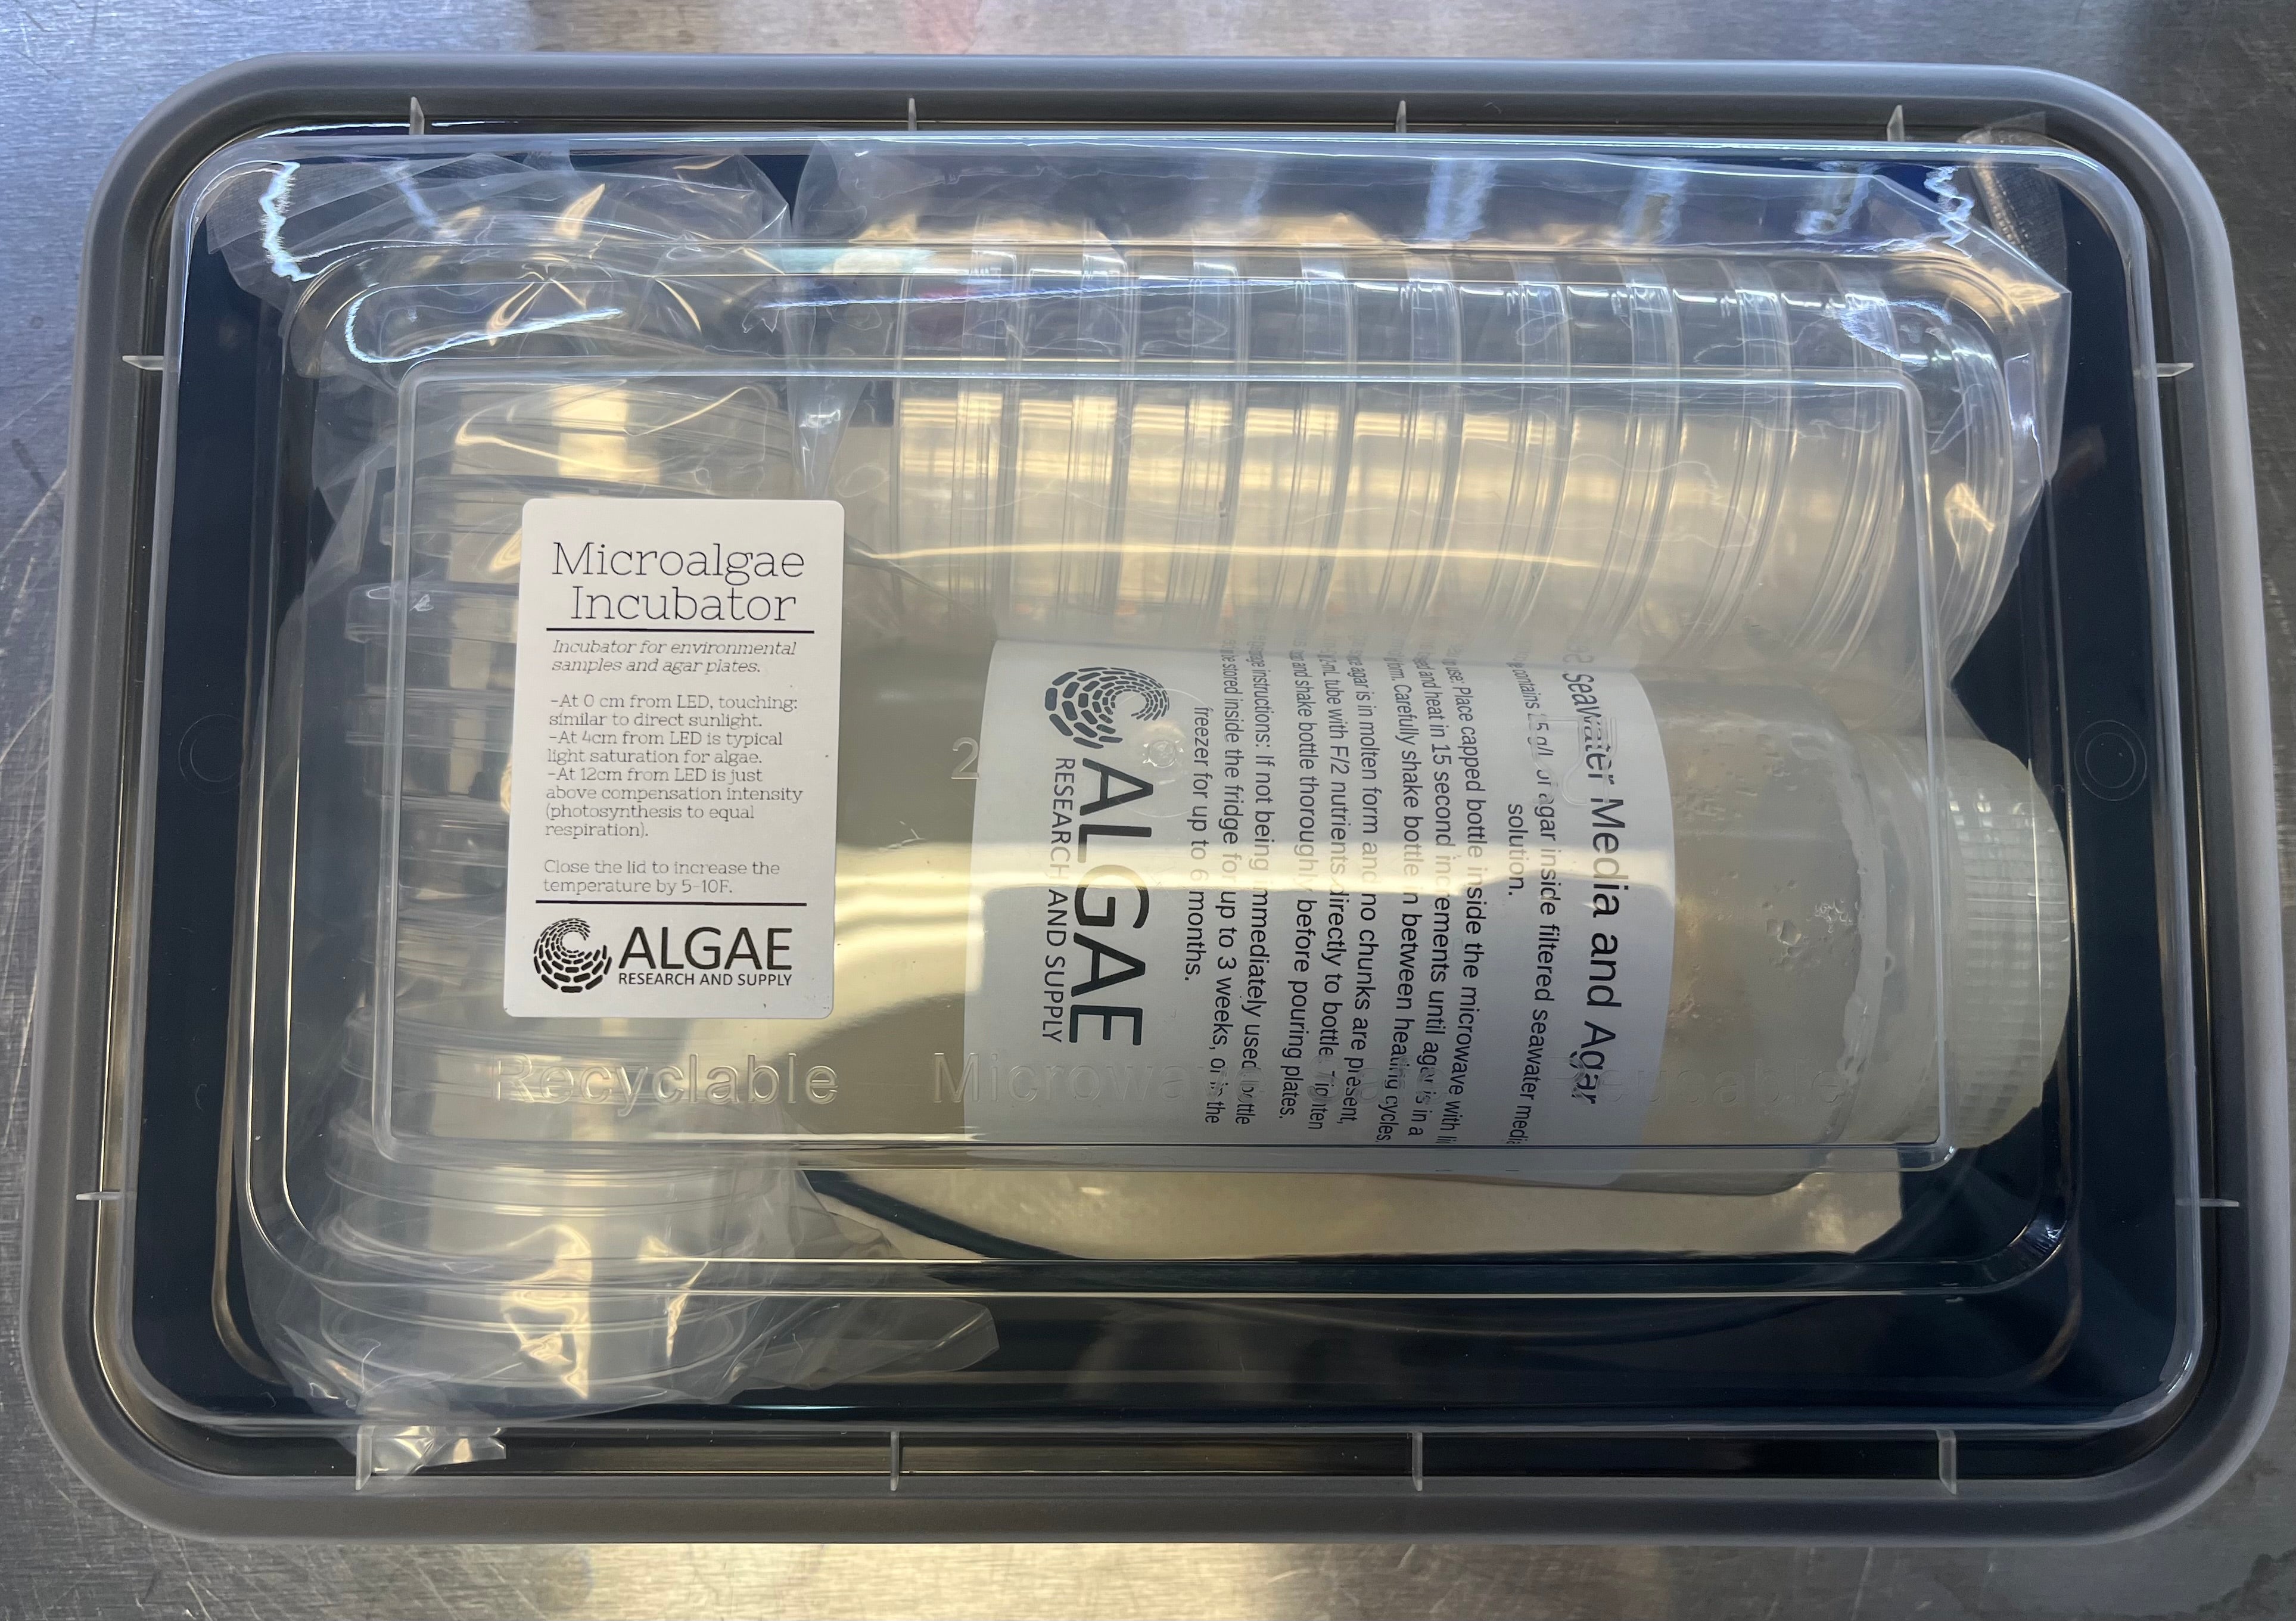
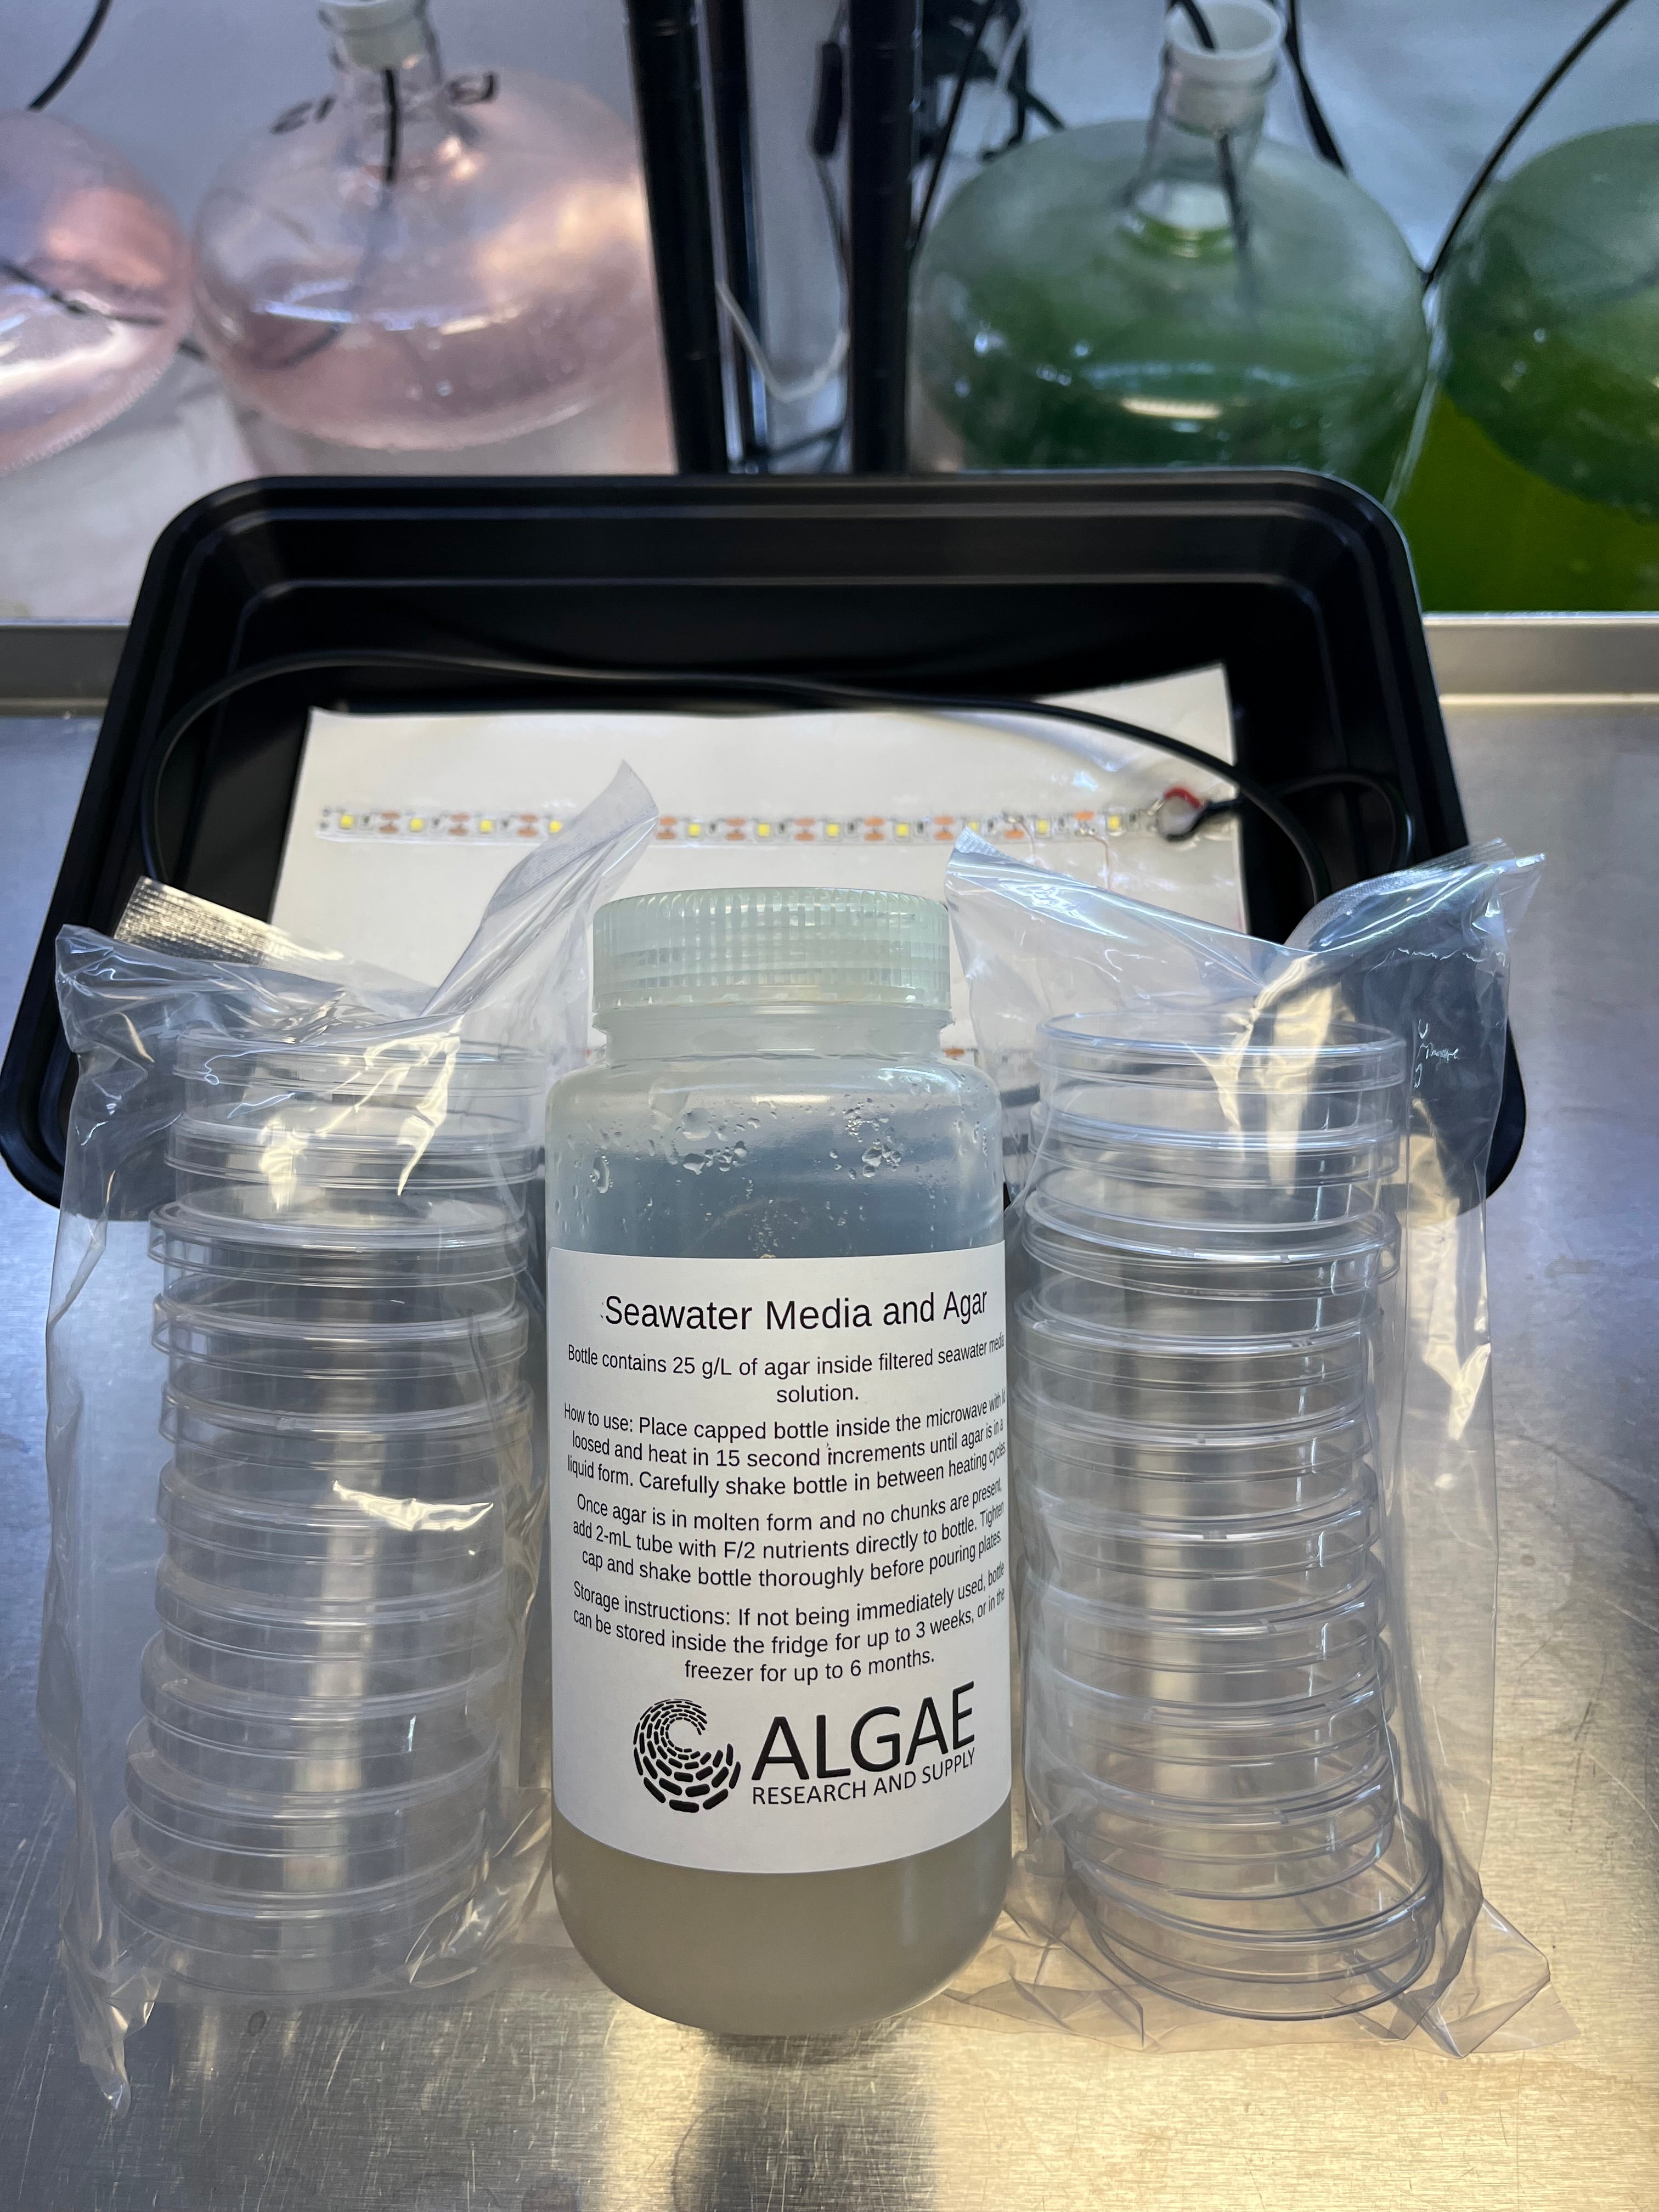
Free kit. Free materials. Participate in research education.
In Phase 1A
117 kits shipped to classrooms nationwide
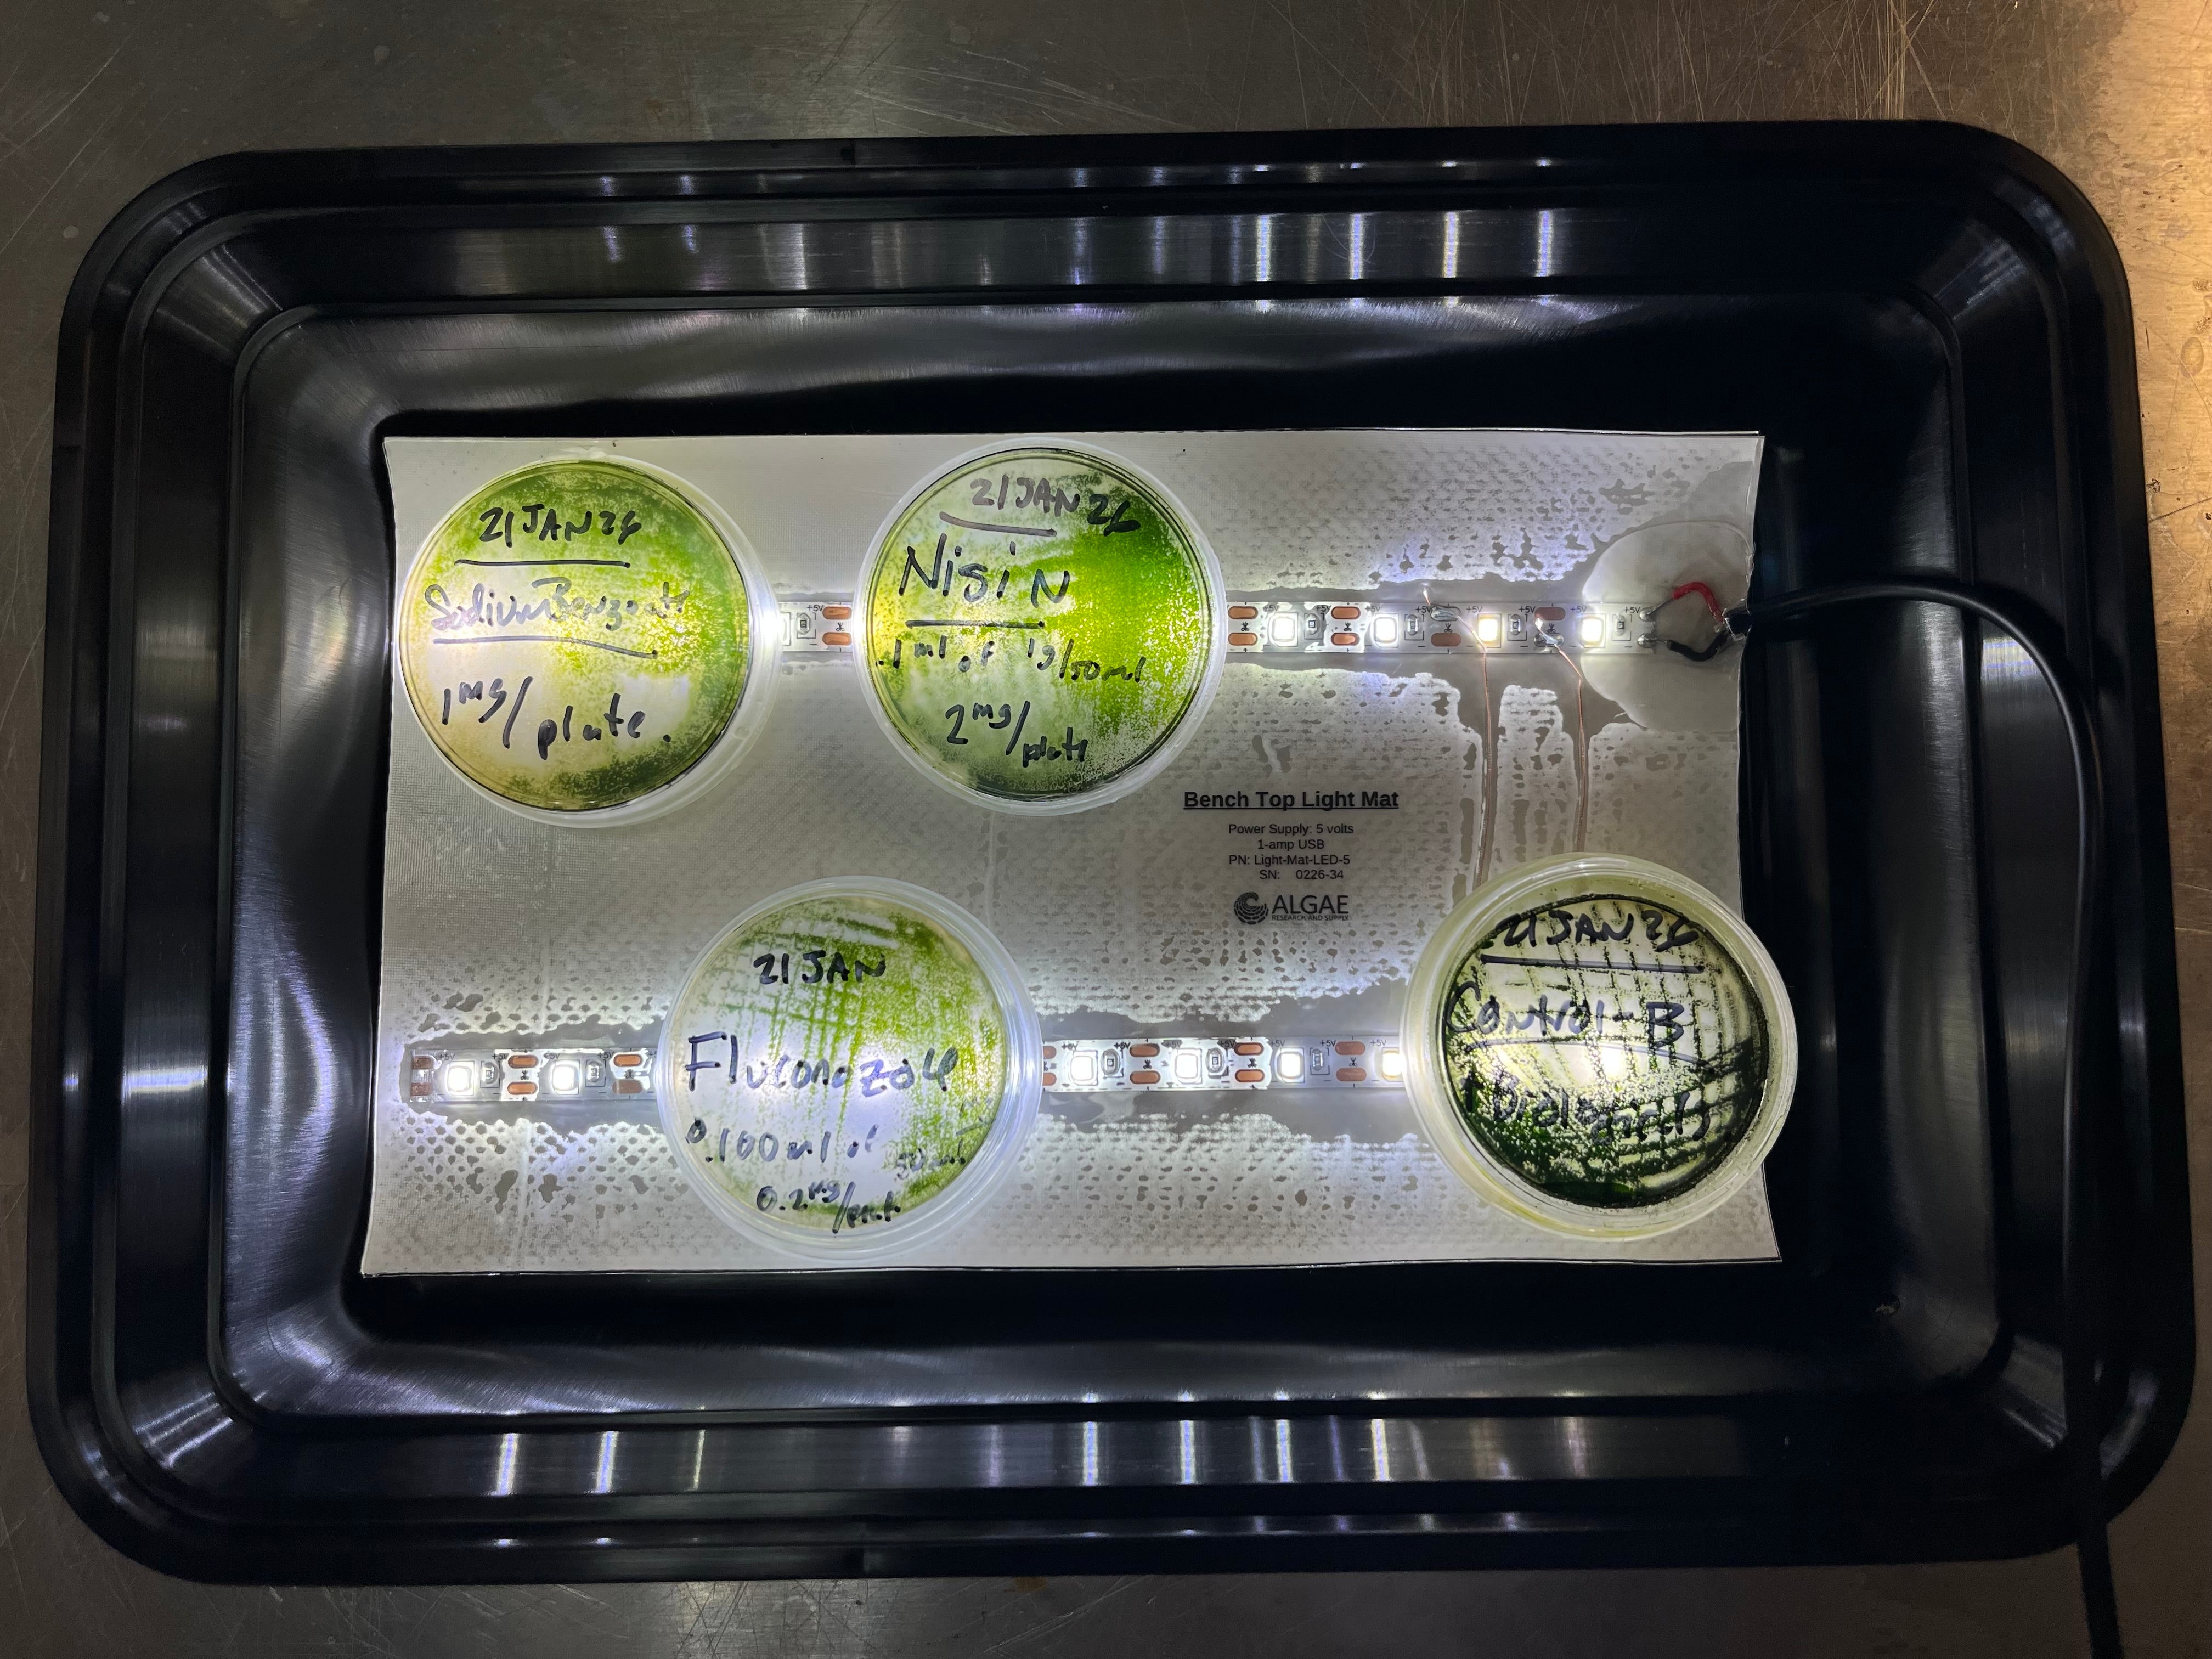
300 students tested the workflow, with measurable gains in science confidence and retention
>200 teachers have already signed up to prototype with us in Phase 2
How Signing Up Works

Featured collection
Vendor:Algae Research Supply